Environment and Energy Audit:
Lovely Professional University Regularly conducts (yearly basis) Environment and Energy audit with the objective to assess and evaluate environmental and energy performance, identify areas where energy wastage is highest, and develop strategies for achieving greater sustainability and efficiency. Environmental and energy audits play a crucial role in helping University to identify and address sustainability and efficiency challenges, ultimately contributing to a more environmentally responsible and financially sound operation.
Link for Environmental Audit:
Click here, Click here
Link for Energy Audit: Click here
The reports determined that the combined emissions from scope 1 and scope 2 amount to nearly 3648 tonnes of CO2 equivalent for the 2022-23 session.
University has taken various initiatives to identify the energy wastage of the energy consumption. University modified power distribution system like turning off some transformers to save no load losses. Nature and type of lightning lamps were also examined by the audit committee. Recommendations of the audit committee being implemented.

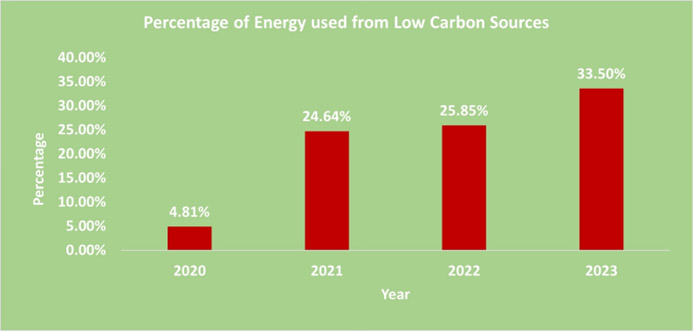
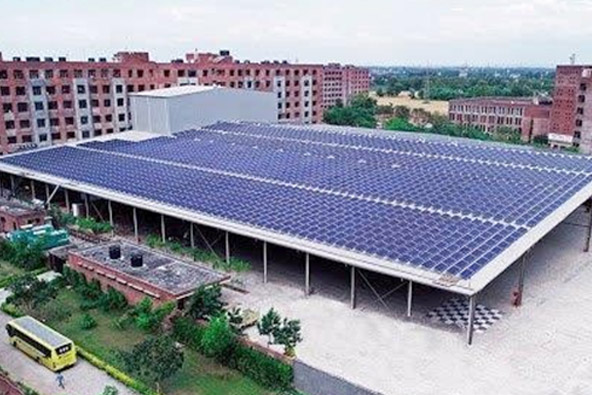
The University’s commitment to guidelines contributes to the United Nations’ sustainable development goals, and it’s worth noting that in 2018, the University erected a 1.1 MW rooftop solar PV plant. Currently, 7.5 MW of Solar power plant is installed in the university. With these initiatives, Not only has the university lowered the total power use from the conventional resources, but it has also boosted the university’s renewable generation. From the graph below it was observed that the percentage of Energy Produced from low carbon resources with respect to the total energy production is increasing from the previous years. The percentage of energy produced from low-carbon resources has shown a significant upward trend over the past four years, increasing from 4.81% in 2020 to 33.5% in 2023. This highlights a strong movement towards cleaner energy production and a reduction in reliance on high-carbon energy sources.
Summary of Power Generation and Consumption with the Aid of Solar Panels
| Sr No. | Month | Solar 100 kW power generation (in kWh) | Solar 01 MW power generation (in kWh) | Solar 2.097 MW power generation (in kWh) |
|---|---|---|---|---|
| 1 | Jan.2023 | 5803 | 51576 | - |
| 2 | Feb.2023 | 9775 | 86354 | - |
| 3 | March.2023 | 11564 | 94527 | - |
| 4 | April.2023 | 11432 | 121968 | - |
| 5 | May.2023 | 12577 | 115496.00 | - |
| 6 | June.2023 | 12707.4 | 95033 | - |
| 7 | July.2023 | 9919.9 | 46160 | - |
| 8 | Aug.2023 | 10624 | 83993 | 268926.9 |
| 9 | Sept.2023 | 11451 | - | 246367.2 |
| 10 | Oct.2023 | 9614 | 135730 | 202404.4 |
| 11 | Nov.2023 | 7915 | - | 107623 |
| 12 | Dec.2023 | 4124 | - | 118448 |

- Total Energy generated/consumed from solar panel = 1892113 kWh
- A gigajoule (GJ) is the equivalent to 1 billion joules. A joule is a measure of the energy required to send an electrical current of one ampere through a resistance of one ohm for one second. One GJ is equal to 277.8 kilowatt hours (kWh), 1.055 million British thermal units (Btu) or 0.17 barrels of oil.
- Total Energy generated/consumed from solar panel = 1892113/277.8 Gigajoule
- Total Energy generated/consumed from solar panel =6811.1 Gigajoule
- Total Energy generated/consumed from solar panel =6811.1 Gigajoule

Bio Gas plant:
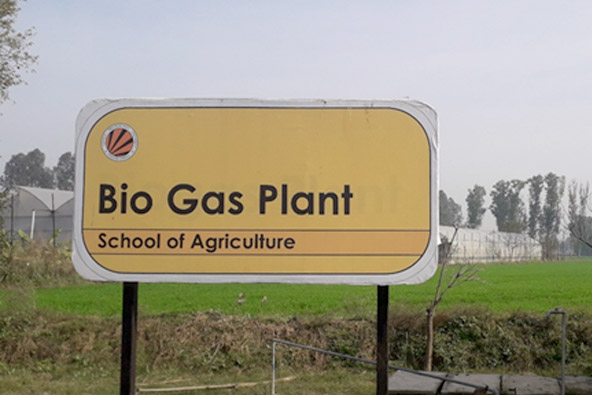
A biogas plant based on ‘Deenbandhu model’ is constructed to produce biogas from cattle dung. To reduce greenhouse gas emissions and the risk of pollution to waterways, organic waste can be removed and used to produce biogas, a renewable source of energy. Biogas contains roughly 50- 70% methane, 30-40% carbon dioxide, and trace amounts of other gases. The University currently has 3 cubic meter operating biogas systems across the campus to process kitchen waste. Apart from the cattle dung, sewer waste is also fed into the plant to produce biogas.


